ParticleViz
Visualizing Lagrangian model outputs the easy way.

Welcome to ParticleViz
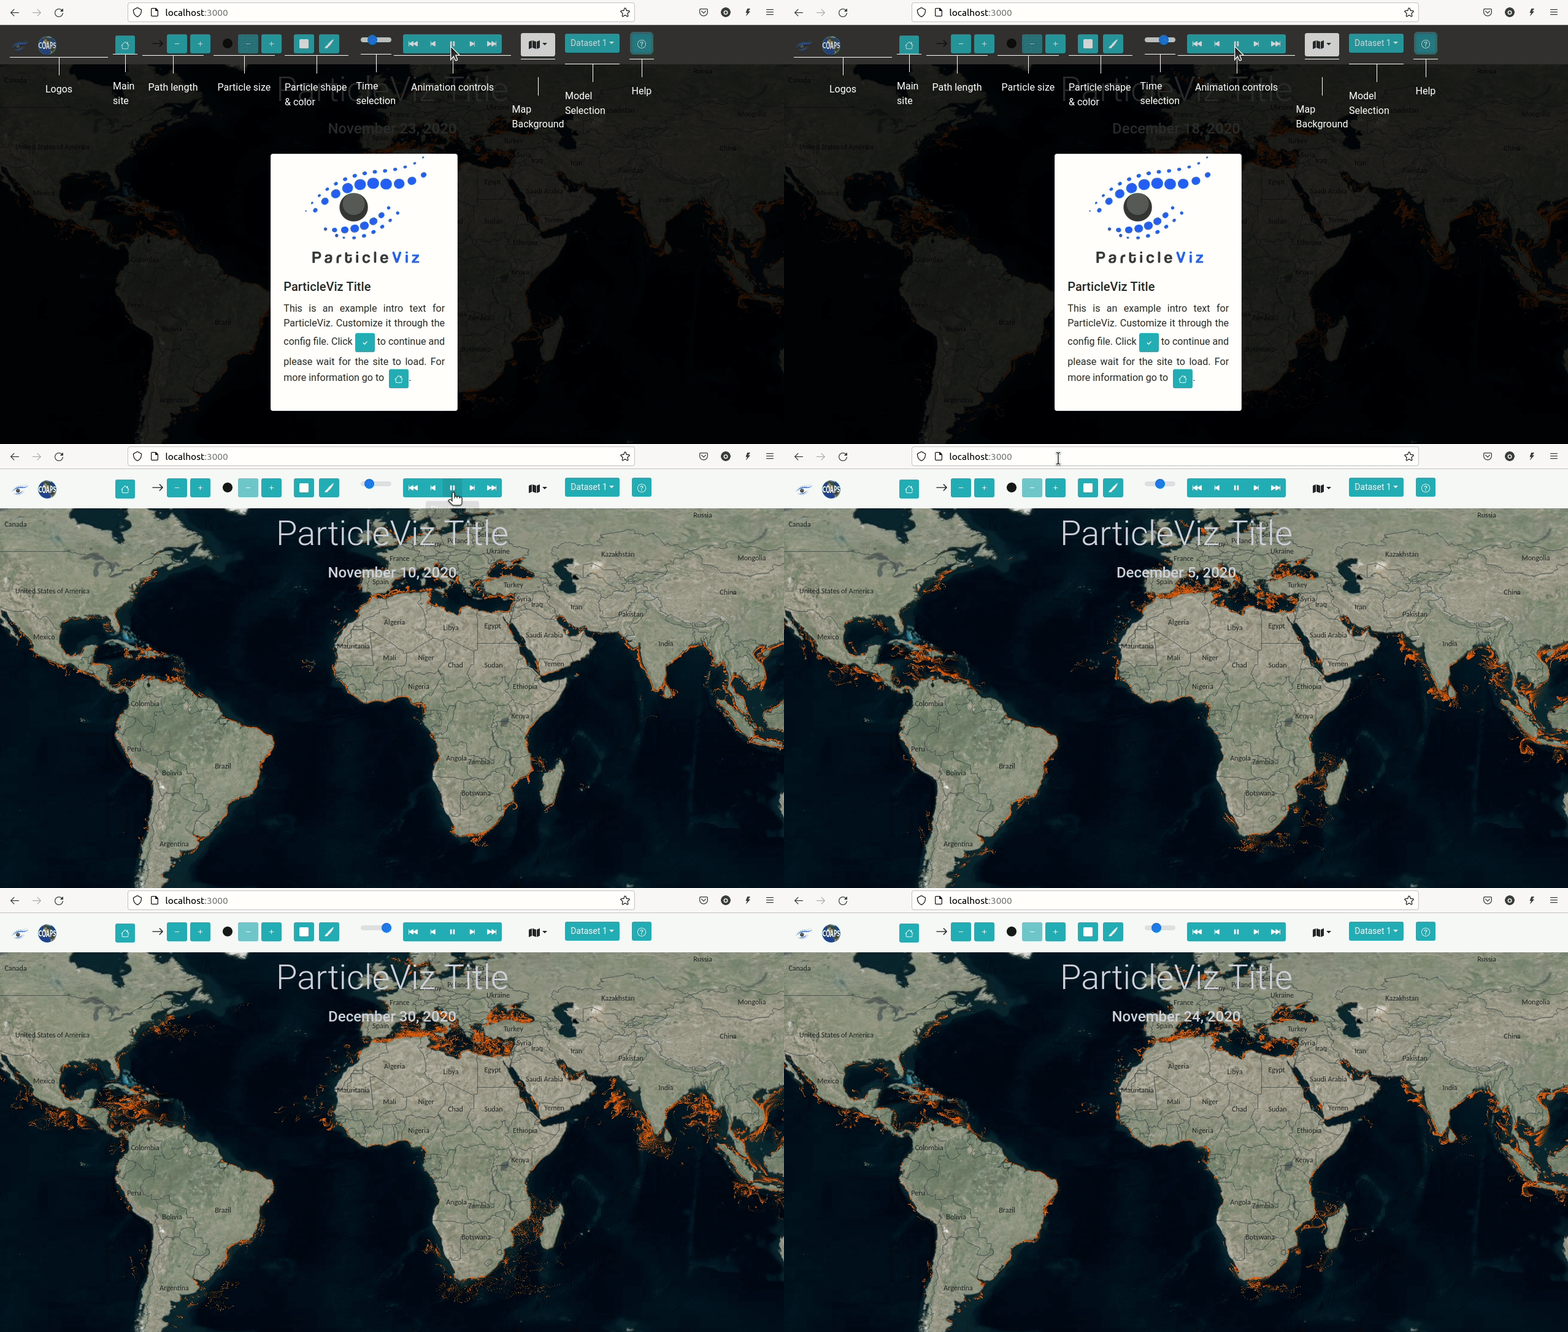
ParticleViz is an Open Source software that is used to visualize large number of particles inside dynamic web maps. It is designed mostly for Earth Science scientists that simulate different processes using Lagrangian models.
The objectives of this software are:
- Provide efficient visualizations that can help analyze and understand research made through lagrangian modelling in the Earth Sciences, in a fast and easy way.
- Make it easy to share this research with other colleagues with selfcontained websites.
ParticleViz currently reads NetCDF outputs from OceanParcels.
Status


Install
Classic steps:
- Clone repository
- Create conda environment with the proper dependencies
- Enjoy life
git clone https://github.com/olmozavala/particleviz.git
cd particleviz
Anaconda
Create new environment from yml file and active it.
conda env create -f particleviz.yml
conda activate particleviz
Quick Start
Once you have installed the Python dependencies and JS dependencies, then the simplest way to use ParticleViz is to run it specifying the input netcdf from the command line directly (the netcdf file should have the format from OceanParcels). You need to be patient the first time you run it because it will install all the Javascript dependencies. It will be much faster after that. This will generate the default web interface to display your data.
python ParticleViz.py --input_file <path to netcdf>
Test it with the Global_Marine_Debris.nc file inside the ExampleData folder with:
python ParticleViz.py --input_file ExampleData/Global_Marine_Debris.nc

Advanced Configuration
ParicleViz generates websites in two steps:
- Preprocessing. This first step transforms the lagrangian outputs into multiple binary files that can be transferred efficiently by the internet.
- App builder. The second step generates a website (react app) that reads binary outputs from the preprocessing step.
All the customizations of these two steps are made through
a json file. There are several examples at the ConfigExamples folder.
The simples config file you can generate will have just information on the location
of your dataset, like this:
{
  "preprocessing": {
    "models": [{
        "name": "Dataset 1",
        "file_name": "./ExampleData/Global_Marine_debris.nc"}]
    }
}
To run ParticleViz from a config file you can do it with the following options
  ParticleViz.py  all --config_file <config_file>
  ParticleViz.py  preproc --config_file <config_file>
  ParticleViz.py  webapp --config_file <config_file>
To run both steps, Preprocessing and App builder, you will use the all command.
To only preprocess your data you you will use preproc and
to only generate the website you will use webapp (you need to run preproc at least once before
running webapp).
A configuration file example with all the possible options is the following:
{
  "preprocessing": {
    "models": [
      {
        "name": "January 2010",
        "file_name": "./ExampleData/Global_Marine_Debris.nc",
        "subsample": { "desktop": 2, "mobile": 4 }
      },
      {
        "name": "January 2010",
        "file_name": "./ExampleData/Global_Marine_Debris.nc",
        "subsample": { "desktop": 6, "mobile": 8 }
      }
    ],
    "output_folder": "./ParticleViz_WebApp/data/"
  },
  "webapp": {
    "data_folder": "./data",
    "title": "Marine Plastic Debris Advanced",
    "particles_color": "rgba(255,105,0)",
    "intro_image": "",
    "url": "https://www.coaps.fsu.edu/our-expertise/global-model-for-marine-litter",
    "intro": "This is an example of a ParticleViz visualization of Marine Debris. Try other example configuration files and then with your own data!!!! ",
    "zoom-levels": [ 0.24, 0.12, 0.045, 0.01125, 0.0028125 ],
    "def-zoom": 1,
    "map-extent": [ -180, -90, 180, 90 ],
    "map-center": [ 0, 0 ],
    "logos": [{
      "img": "logos/logo_example.png",
      "url": "https://olmozavala.com"
    }],
    "extra_layers": [
      {
        "name": "World Cities",
        "file": "extra_layers/capitals.geojson",
        "color": "rgb(255,237,0)"
      }
    ]
  },
  "advanced": {
    "timesteps_by_file": 200,
    "file_prefix": "GlobalLitter"
  }
}
You can test this advanced configuration file with:
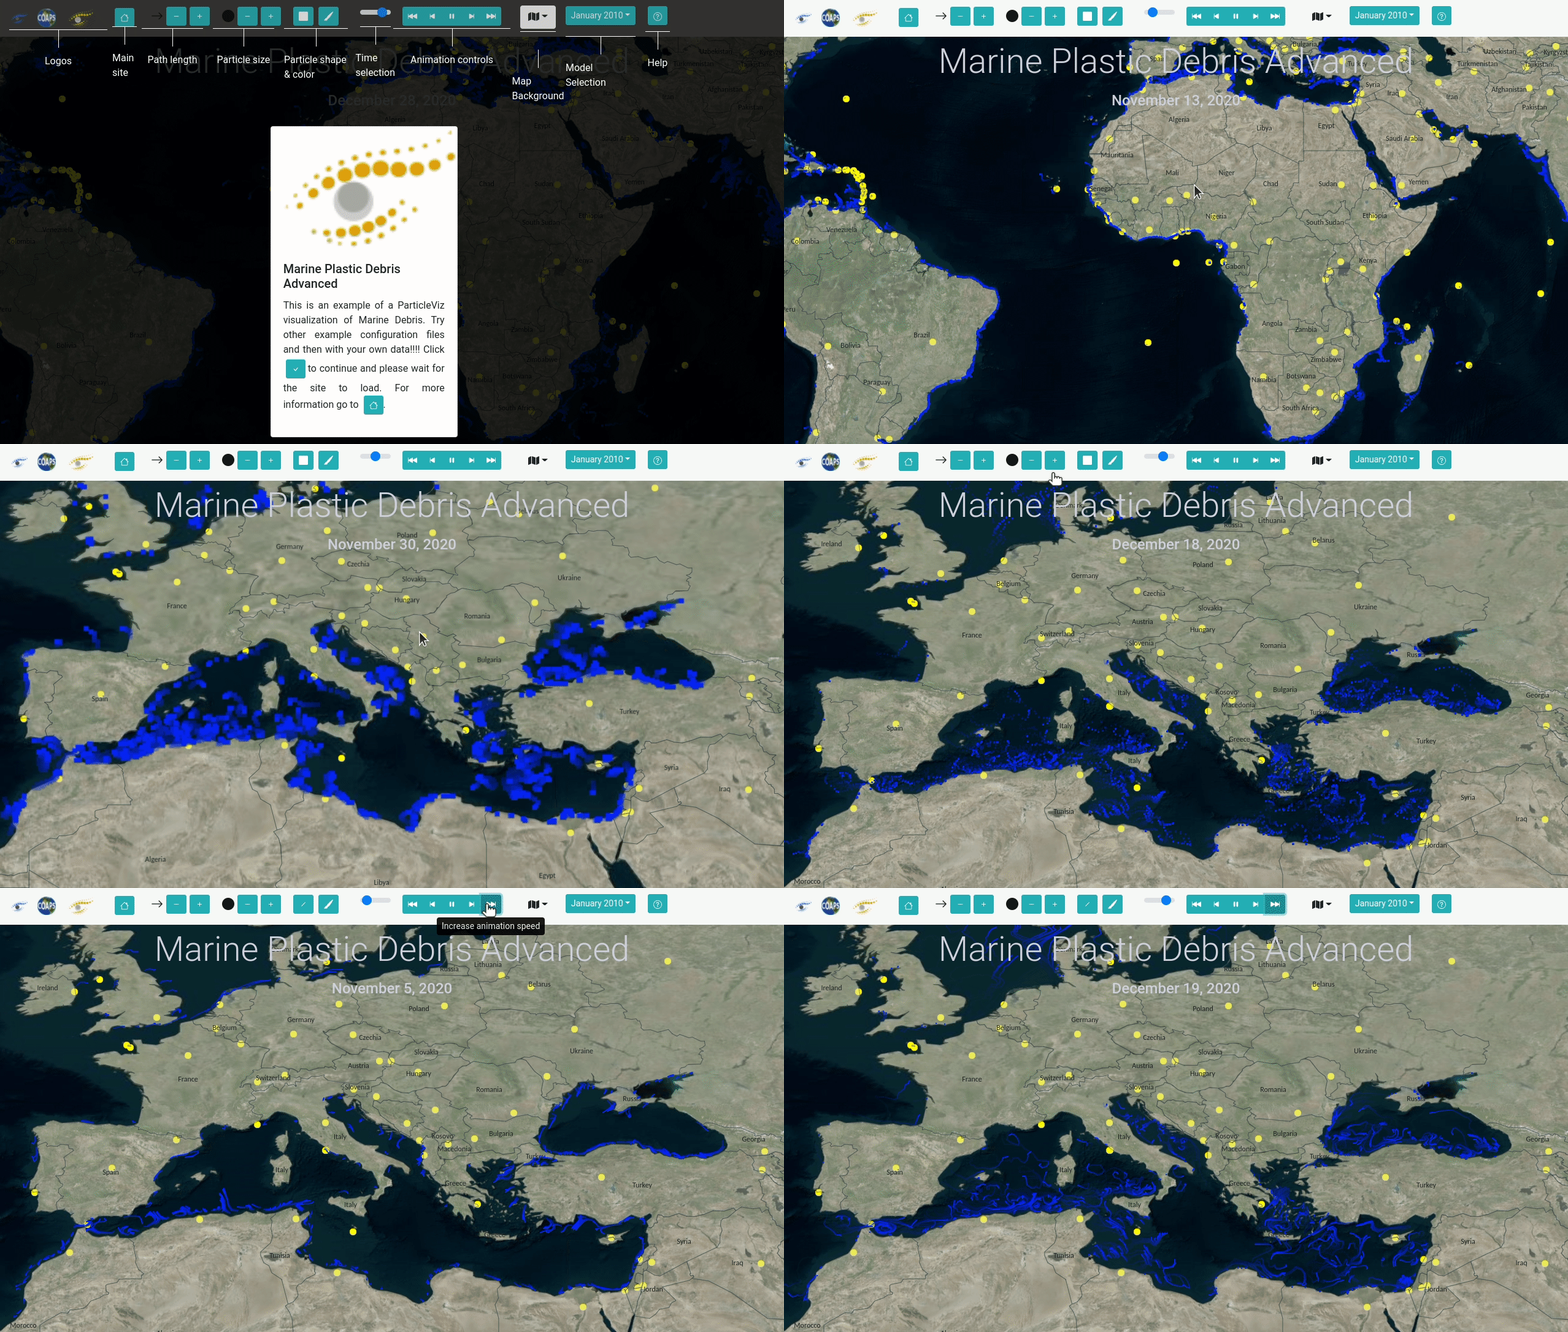
python ParticleViz.py all --config_file ConfigExamples/Config_Advanced_Example.json

Parameters
Even though most of the parameters are self-explanatory, the meaning of each of them for the Preprocessing section is the following:
| Parameter | Required | Depth Level | Description |
|---|---|---|---|
| models (array) | True | 1 | A list of models to be added into the visualization. Each model will be available from a dropdown field. |
| name | True | 2 | The name of your model, it will be the name that appears in the dropdown. |
| filename | True | 2 | The path to the netcdf file that stores your model output. |
| subsample | False | 2 | It is used to indicate if we need to subsample your data for display purposes. |
| desktop | True | 3 | An integer value that indicates how much to subsample the data. Ex. a number of 2 means only half of the particles will be visualized (randomly). A 3 means only one third, etc. |
| mobile | True | 3 | An integer value that indicates how much should we subsample the data. |
The list of parameter for the webapp section is the following:
| Parameter | Depth Level | Description |
|---|---|---|
| title | 1 | The title being displayed on the map. |
| particles_color | 1 | Default color to be used to display the particles. |
| data_folder | 1 | Path where data (logos, extra layers, etc.) is stored. |
| intro_image | 1 | Relative path (to data_folder) for an image to use as intro image. |
| url | 1 | Default url for the home icon. |
| intro | 1 | Intro text for the intro page. |
| zoom-levels | 1 | Available zoom leves that an user can scroll in the map. These numbers must be in decreasing order. (larger numbers are to visualize larger areas and smaller numbers are used for smaller/zoomed in regions). |
| def-zoom | 1 | Default zoom index to use. This should be an integer from 0 to the total length of zoom-levels. |
| map-extent | 1 | Restrict the area where the user can pan the map. |
| map-center | 1 | Sets the default center of the map. |
| logos (array) | 1 | List of additional logos. |
| img | 2 | Path to an image to use in this logo. This path is relative to the data_folder. |
| url | 2 | Url to open when clicking on the logo. |
| extra_layers (array) | 1 | List of additional geospatial layers to show in the map. Must be in geojson file format. |
| name | 2 | Name of the additional layer. |
| file | 2 | Path to the geojson file to add. This path is relative to the data_folder. |
| color | 2 | Color to use to display the extra layer. |
Server Deployment
If you want to share your visualization with the world, you will need to deploy your site on a computer with a public ip address or in an existing web server. The proper way to do it is to build an optimized version ready for production and add it into an existing web server.
Here are the most common steps to do this:
- Build your optimized build with
npm. Inside theParticleViz_WebAppfolder, use the following command to generate this build (inside abuildfolder).cd ParticleViz_WebApp npm run-script buildIf you see .
- Copy your build folder into you web server. For example, if you have an Apache
web server at
/var/www/htmlyou could copy your project to/var/www/html/myawesomemodel. If you don’t know what I’m talking about ask your IT guy to help you.
Intro video
Here is a presentation made at OceanSciences meeting about ParticleViz in March 2022. YouTube link
